Working with HathiTrust Data
This blogpost is last section of a three-part series providing an introduction to the HathiTrust’s Digital Library and text analysis tools. In Part 1, I provided a brief introduction to text analysis and showed how to create collections in the HathiTrust Digital Library. In Part 2, I discussed how the HathiTrust Research Center’s inPho Topic Model Explorer allows us to perform a particular kind of text analysis operation. Finally in Part 3, below, I discuss ways of accessing and analyzing the HathiTrust’s data at scale.
All three posts in this series are written to provide a narrative overview to these slides on Working with HathiTrust Data. I have organized these posts following the modules from the slides to allow the reader to move between the two and focus on the sections that are most interesting to them. This post is aligned with Modules 4 and 5 in the slides.
The HathiTrust Digital Library preserves and provides access to over 17 million books spanning more than four centuries. It was created in 2008 by digitizing and bringing together the physical collections of a number of distinguished academic research libraries. Today, The HathiTrust Digital Library comprises over 120 partner institutions who continue to contribute to its collection. Alongside the Digital Library, the HathiTrust Research Center provides tools that facilitate text analysis on its vast corpus.
Introduction to the Bibliographic API and the Extracted Features Dataset
The HathiTrust created the Bibliographic API to provide more robust access to its data and allow researchers to work with large batches of texts. The Bibliographic API is a digital pathway that allows programmatic access to the HathiTrust’s data. The API enables researchers to write code that automates processes that gather and arrange data held by the HathiTrust, allowing the use of thousands of texts at scale. In order to use the API, researchers will require a working knowledge of higher level languages like python and data standards like JSON. The accompanying slides provide more information about structuring API calls in Module 4.
In addition to the Bibliographic API, the HathiTrust has also built the Extracted Features dataset, which opens versatile approaches to working with its data. The Extracted Features dataset contains additional structured data, such as word and sentence counts, publisher’s name, place and date of publication, language, genre, among many others, for each page in more than 17 million volumes in the HathiTrust Digital Library. Accessing and analyzing the Extracted Features Dataset requires a familiarity with languages like r and python. Those interested in working with Extracted Features dataset might also look into the HTRC Feature Reader, which is a python library that simplifies access to the Extracted Features Dataset. The Extracted Features Dataset can be accessed via rsync as well.
The Extracted Features Dataset has been used to create a variety of tools, such as the Word Similarity Tool and Bookworm (which I discuss below). Furthermore, the Extracted Features Dataset has also been used to create additional datasets such as “Word Frequencies in English-Language Literature, 1700-1922,” which contains the word frequencies for all English-language volumes of fiction, drama, and poetry in the HathiTrust Digital Library that were published from 1700 to 1922.
I do not go into too much depth with the Bibliographic API or the Extracted Features dataset here because the way in which these resources might be used depends, to a large extent, on the research questions and methodologies driving each project. I highly recommend those at the Graduate Center join the Python User Group, R User Group, or the Digital Archive Research Collective, where the Bibliographic API and the Extracted Features Dataset can make very useful topics of exploration within specific communities of practice.
HathiTrust + Bookworm
In this final section, we will look at Bookworm, another tool provided through the HathiTrust Research Center. Bookworm provides a visualization interface that draws on the Extracted Features dataset to show word usage trends over time.
To access Bookworm, click “Explore” in the HathiTrust Research Center’s top menu. This takes us to page with many in-development tools at the HathiTrust Research Center. Here, we can find many ways of visualizing word trends using Bookworm, such as heatmaps and bar charts.

Fig 1: Bookworm tools in the HathiTrust Research Center
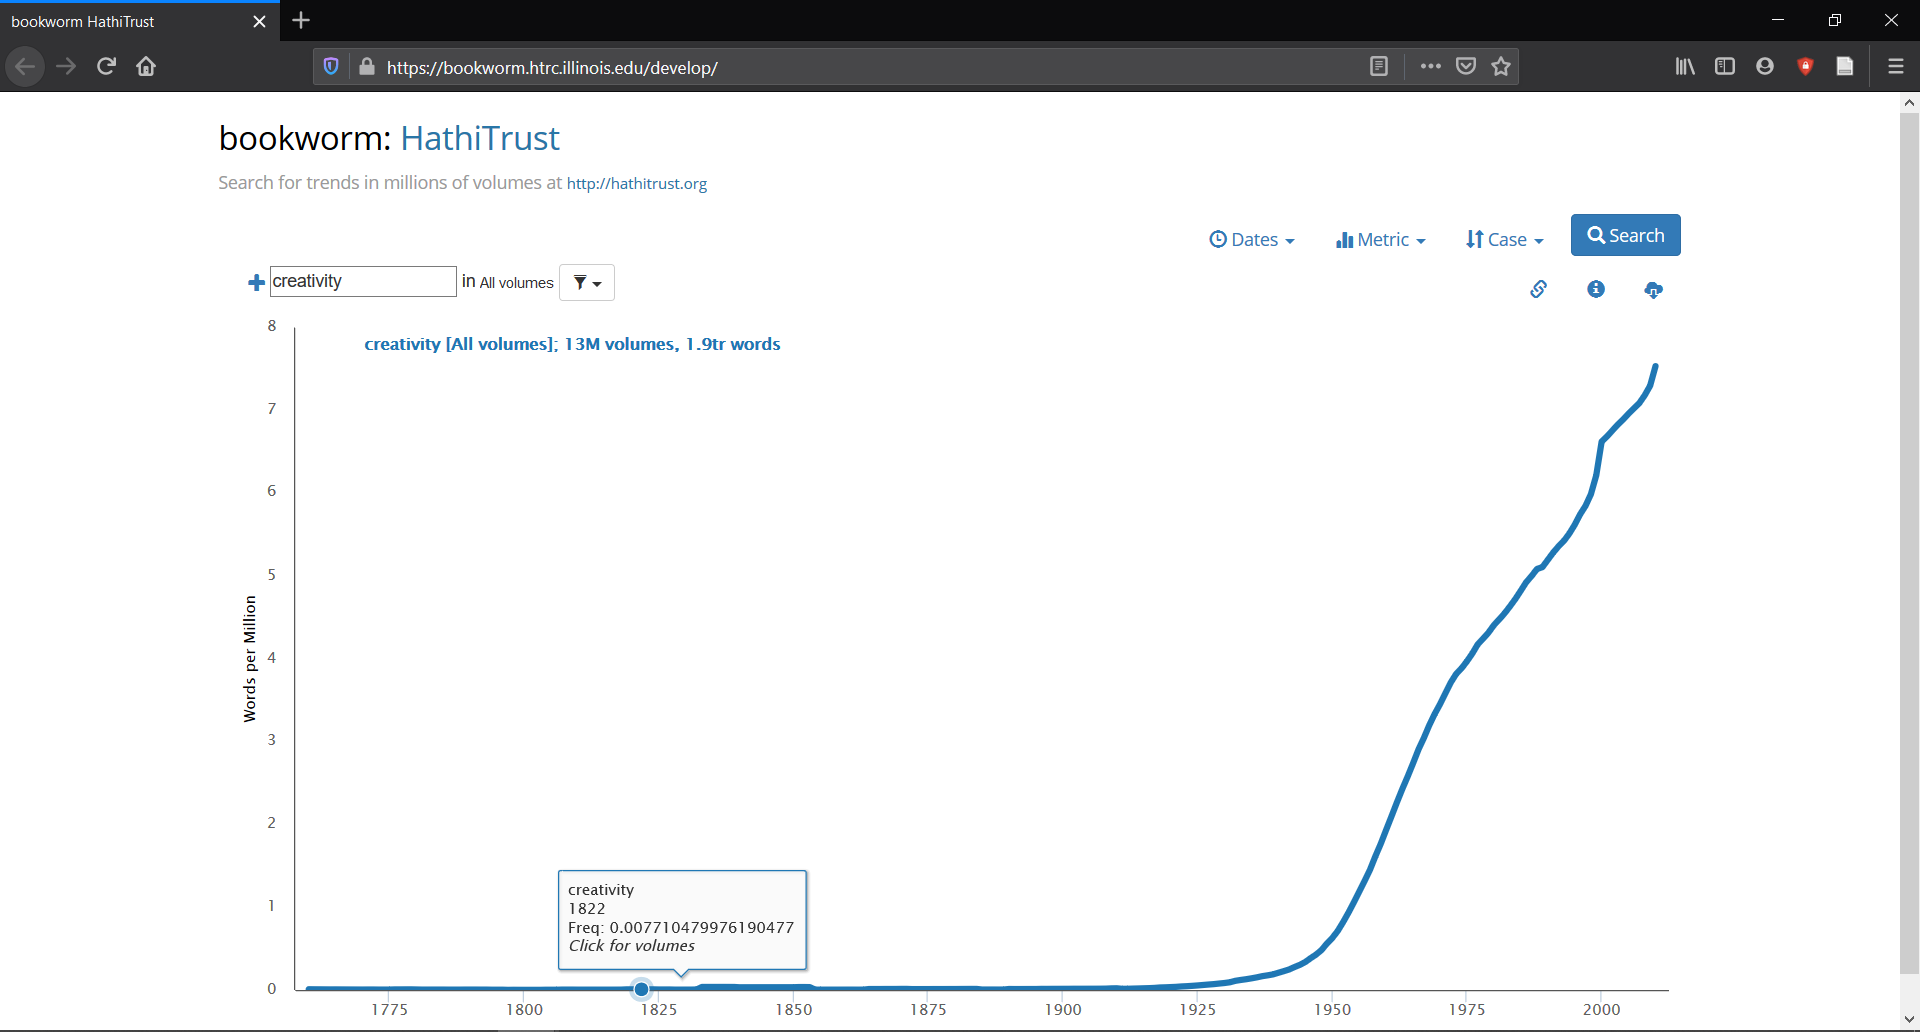
Clicking on the “HathiTrust + Bookworm” option will take you to a page featuring a default line graph. The default value of the x-axis is years, with the y-axis representing words per million. Here you will find a search box, which is usually pre-filled with the word “creativity.” You can simply replace “creativity” with any term that you fancy to get a rough and ready gauge of its popularity over the past three centuries.

Fig 2: HathiTrust + Bookworm Interface
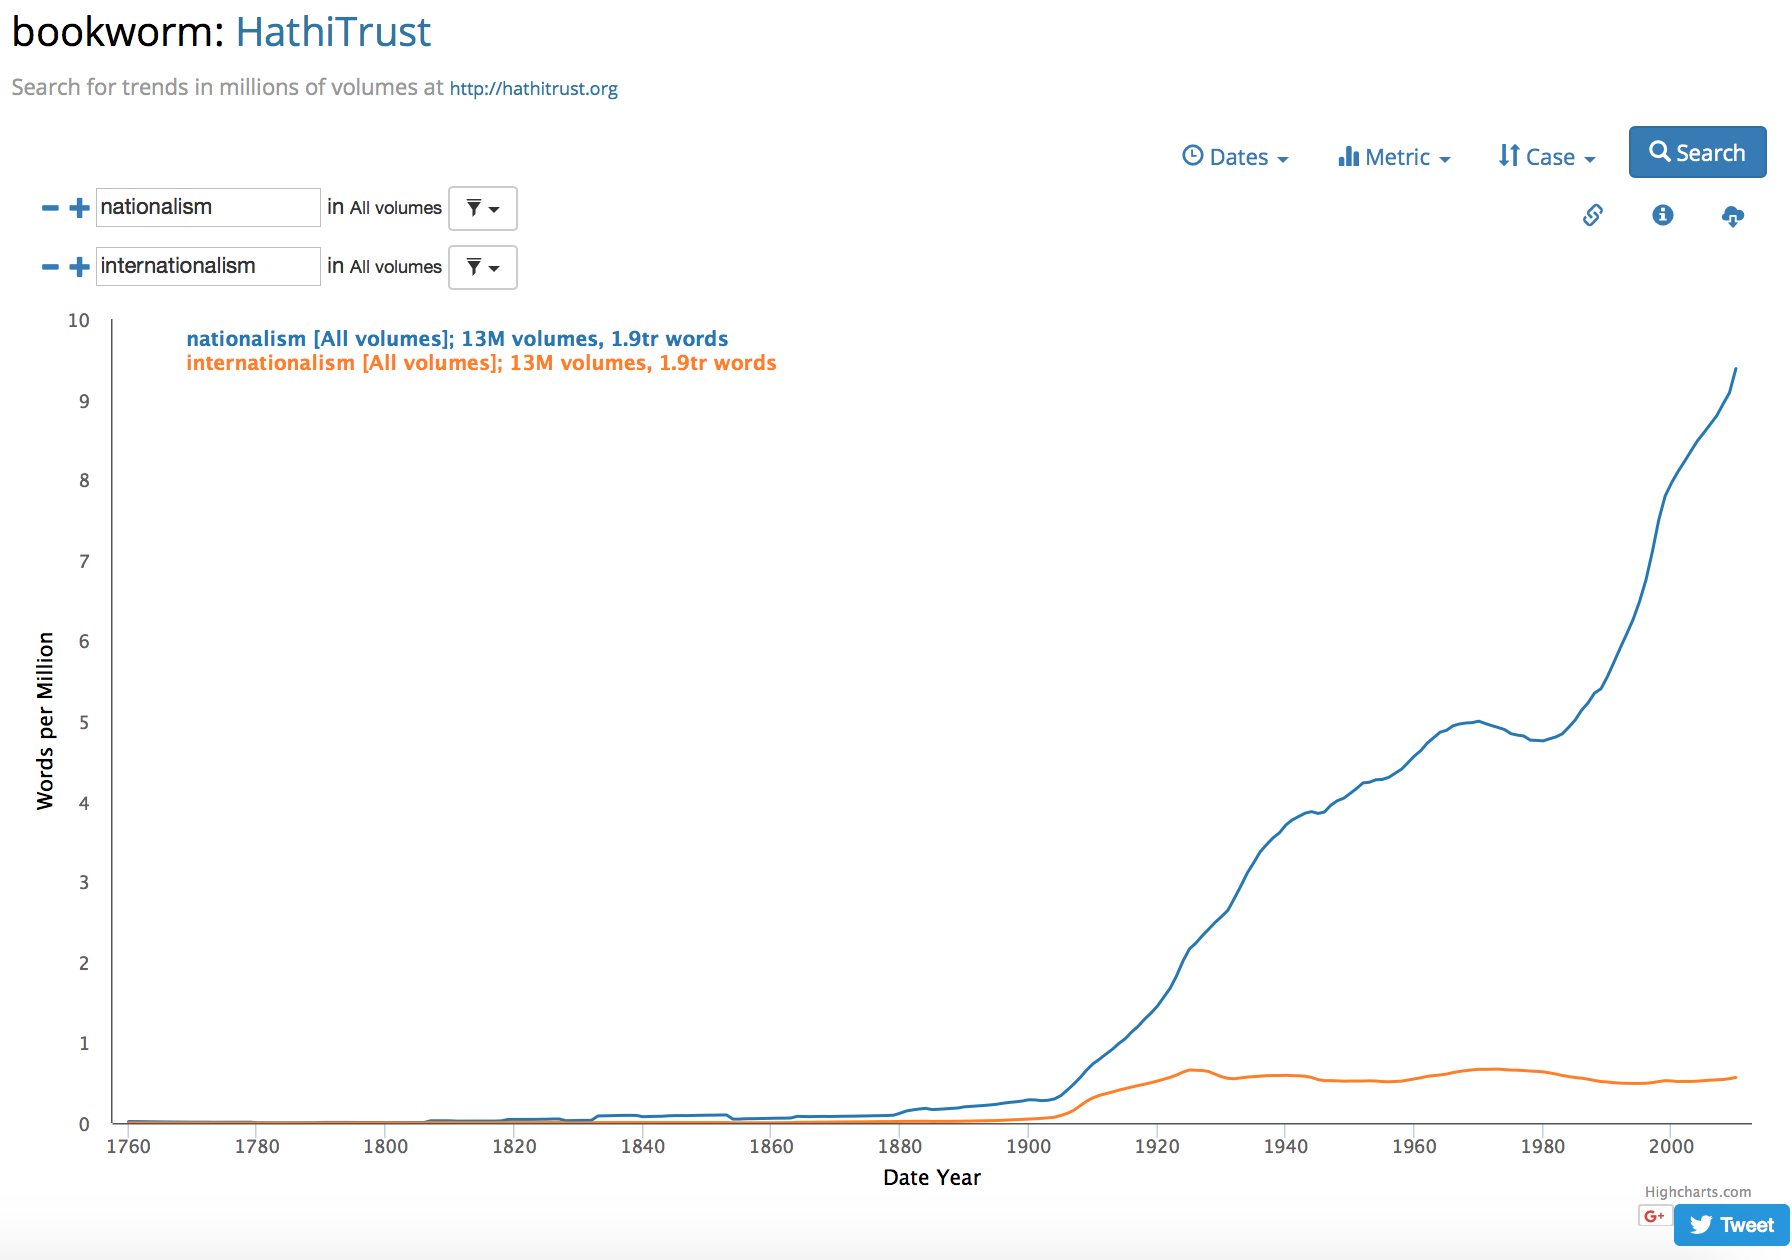
Bookworm also permits tracking the trends of multiple words simultaneously. You can add more terms to the search bar by clicking on the ” + ” symbol.

Fig 3: Multiple Searches on HathiTrust + Bookworm
Clicking on the funnel icon next to the search bar provides ways of limiting the search using a number of parameters.

Fig 4: Limiting the Search on HathiTrust + Bookworm
You can further fine-tune the visualization by adjusting the “Dates,” “Metric,” and “Case” tabs on the top right.

Fig 5: Fine-Tuning Your Visualization
The bookworm visualization also links directly to the HathiTrust digital library. Clicking on a location on the visualization allows the researcher to read individual results.

Fig 6: Going from HathiTrust + Bookworm to an individual text in the Digital Library
Conclusion: What Next?
Now that you have an introduction to some of the ways in which the HathiTrust makes its data available, please feel free to tinker with the tools available. You can begin by searching the HathiTrust Digital Library to get a preliminary sense of the kinds of texts it holds. You may also consider learning additional languages like python or r to further enhance your ability to work with the HathiTrust dataset. For those interested, the HathiTrust has provided very helpful teaching materials that discuss additional tools.
I highly encourage thinking of the data and tools made available by the HathiTrust as a point of beginning in the research process. Maybe a topic model makes you wonder why seemingly different concepts are related. Perhaps a peak in a bookworm visualization makes you question why certain themes are surging in a particular moment in time. Such kinds of insight can help you refine your research questions and read your findings in a new light.
Acknowledgements
This post was made possible from these slides, which were initially created by the HathiTrust, with subsequent edits made by Stephen Klein, Roxanne Shirazi, and Stephen Zweibel of the CUNY Graduate Center Library.


