In this in-person workshop participants will have the opportunity to work hands-on to decide what kind of project they want to create, learn about different software options and technical considerations before they get started. The workshop takes into consideration questions such as how to plan the archive thinking of sustainability.
In this virtual workshop participants will be introduced to the concepts of algorithmic thinking. An algorithm is a step-by-step process for solving a problem. Knowledge of basic algorithmic principles is invaluable in reading and understanding computer code. No prior coding experience is necessary for this workshop, but students with prior experience are still strongly encouraged to attend. The skills learned will be applicable in any programming language.
Dear beginners to Digital Humanities and non-coder academics,
I have some good news for you: you can begin your digital humanities project and explore different tools before you learn to code or not learn to code at all. As scholars, we continue to learn and decide which digital skills are best suited for our research and projects. We may learn a skill and later decide our efforts are best spent honing a different digital skill or methodology. The most common coding languages we, the GCDFs, use and teach are R and Python. But, until you decide to learn either, both, or another coding language, there are tools you can use to execute your digital research and projects.
A tool that many of us have encountered and that we might not necessarily think of as a DH tool is a spreadsheet softwares in which data is arranged in rows and columns and can be used to make calculations or re-organized to reveal patterns. Spreadsheets are a great tool to store, organize, clean, analyze, and even create simple visuals of data points. They are a helpful beginner tool that can assist you in deciding if you need to use more dynamic systems like databases or write code to perform more complex analysis and synthesis of your data.
Another way spreadsheets can be used is to analyze text. Both Google Sheets and Microsoft Excel feature “Analysis Content” add-ons to allow users to conduct sentiment analysis or topic detection. However, what if you have a machine readable text and you want to use it as a corpus to conduct a text analysis? (A machine readable text: an image, handwritten, or printed text encoded into a digital data format to be machine recognizable. Think of a document where you can highlight individual characters as opposed to a document where you are unable to highlight a single character and the entirety of the document is highlighted because the machine recognizes it as one large character. Or think of those scholarly articles that can be read to you by your text-to -speech application. Both being able to highlight individual characters in a document and having the document read to you indicates that the text is machine readable.) So, if you have a text formatted in plain text, HTML, XML, PDF, RTF, or MS Word, even if it is in a Language Other than English, you can use an open-source tool called Voyant-Tools to upload your corpus or corpora and conduct the text analysis. Voyant-Tools can also assist in widely-reading (or distant reading) a text or formulating research questions.
The benefit of both TimelineJS and Voyant-Tools is that they allow you to either simply use them as is or expand the scope of your project further you become a coder. These tools are examples of open-source, web based, non-coder tools that allow for both beginner DHers and non-coders to gain access to DH strategies and methodologies while avoiding the cost of non-coder proprietary tools. For more DH tool options, both for advanced users and beginners, check out University of Toronto’s Find Digital Scholarship Tools website.
For more on DH methodologies and applications, go to our blog and check out our catalog of events!
Imagine if I gave you a list of items and asked whether it contained a particular element. If it were, say, a list of ingredients, you would probably have no choice but to read every single entry until you found the target item. For instance, does the following list contain “salt”?
TOMATO CONCENTRATE FROM RED RIPE TOMATOES, DISTILLED VINEGAR, HIGH FRUCTOSE CORN SYRUP, CORN SYRUP, SALT, SPICE, ONION POWDER, NATURAL FLAVORING
If we start at the beginning of the list, we might get lucky, and salt could be the first item in the list. In that case, we could stop right away. Or, we could get unlucky, and it could be the last item in the list, or not appear in the list at all. Thus, in the worst-case scenario, we would have to go through every item in the list once.
A task like this is something that a computer can perform very efficiently. If the list is very large, a computer could search for a target element much faster than a human could. But how does a computer know how to perform these kinds of tasks? The computer is following a list of step-by-step instructions. The technical term for such a set of instructions is an algorithm. An algorithm could be very simple. In the example above, where we are searching for a specific ingredient in a list, we could write the instructions in plain English like so:
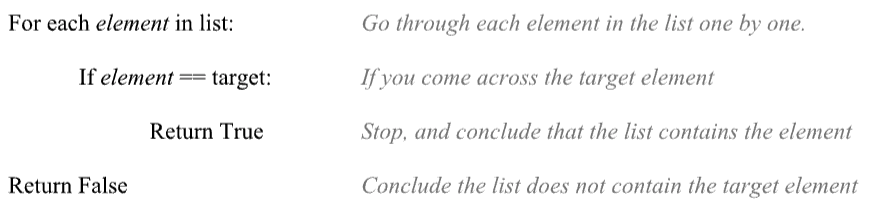
Go through each element in the list one by one. If you come across the target element, stop, and conclude that the list contains the element. If you go through the entire list and do not find the element, conclude that the list does not contain the target element.
We could write this in a format that is a little bit closer to computer code by translating it into the raw steps and translating some of the terms into common coding terms, as such:
The algorithm written above is not in any particular language, but it does contain all of the steps required to produce the correct answer in every case. This is crucially important for an algorithm—it has to give the correct answer in all cases. Sometimes this means you have to be explicit with including certain steps to a computer that might seem obvious to a human. For instance, we need to clarify in the script above that if the item is not found we return “false”, which might be a step that is easy to forget, since it seems obvious.
Computers are great at following these specific instructions, which is one of the things that makes them powerful.
Learning algorithms and practicing solving problems gives you practical coding experience, because you can start with simple problems that can be solved with only the most basic coding commands and tools. It’s a great way to get started writing your own small programs. Once you’ve learned a little bit and written your own code, it becomes much easier to read other code.
Say you want to do a textual analysis of a book you have on your computer. You can easily google this and find a program someone has already written. If you know how to read the code, it will be very easy to use someone else’s code and quickly debug it if problems arise. If you don’t have any experience reading code, you might well struggle for a hours to solve a problem that could be something as simple as a missing parentheses! Learning to read and understand code—even on a basic level—opens up a whole world of possibilities!
Are you interested in learning more about algorithms or getting into coding? Here are some resources I recommend:
For algorithms and python, come to the Graduate Center’s Python User Group (PUG) meetings.
For practicing algorithms, check out leetcode.com. You can create a free account and solve algorithmic problems in your browser. There are thousands of problems on the site, ranging from very simple to incredibly complex. They also have some free learning resources available.
To learn to code, a great resource is https://www.freecodecamp.org/learn.
Finally, look for part 2 of this blog post at the beginning of the Spring semester!
In the last Digital Fellows’ post, Anna Corbett shared a wonderful post on Mapping and Its Discontents. Here I write shortly about Geochicas, an international trans-inclusive community of women that has transformed one of these discontents into collective action and a political project.
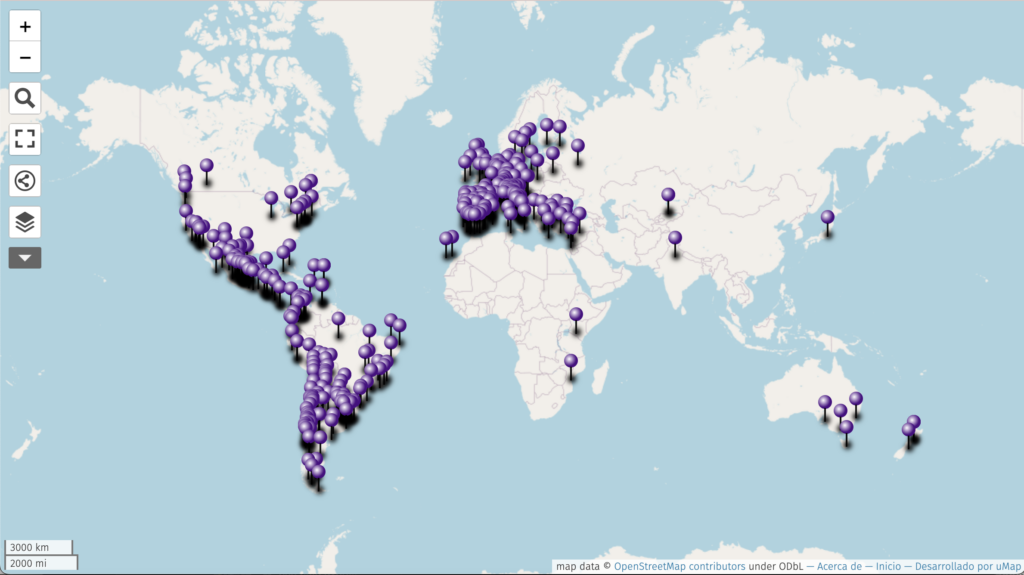
Geochicas creates geodata with a feminist perspective, organizes mapathons and pedagogical spaces to create collectively, and works to reduce the gender gap in OpenStreetMap (OSM) and the OSGeo community as well. In the image above you can see the location of members of Geochicas in the world. They started to work together in 2016 at the State of the Map, the OSM annual conference as a response to the gaps in attendance and presenters.
According to its wiki, OpenStreetMap is a world map with an open-content license that is built by volunteers across the world. It is part of the OpenStreetMap Foundation, which looks for the development of free geospatial data (yes, geospatial data can be proprietary) to use and share.
The first time I read about Geochicas, I was looking for information on feminist mapping. Then, I found their map of the performance Un Violador en Tu Camino (“A Rapist in Your Path”). The performance was created by the Chilean collective Las Tesis in 2019, based on the writings of Rita Laura Segato. The performance became viral and soon re-enacted in many different territories. The map Un Violador en Tu Camino shows the places where the performance “A Rapist in Your Path” took place as shown below:
After learning more about Geochicas, a colleague shared their Telegram channel with me and I have become part of the community –although I have not been able to participate in mapping events, yet. Being part of the conversations has allowed me to see how the political conversations happen and how the feminist collective’s actions take place further than the map as a product: there are cartographic, pedagogical, and political choices that affect society.
From Geochicas’ current projects, and as a sociolinguist, I am particularly enchanted by Las Calles de Las Mujeres (“The Street of Women”), an interactive map that focuses on the name of the streets, particularly streets named after women. From my perspective, visualizing the naming practices in the public space allows us to understand the materiality of language in the places we co-inhabit, and how the collective memory is made by political choices of who has the right to include whom in the public space. The fact that Geochicas decided to identify the streets of women is also an important choice at a time when women from across Latin America have been taking the streets of their cities to manifest issues such as being able to go out without being afraid of not coming back home.
The making of Las Calles de Las Mujeres began in 2018, and it is still an ongoing project, as new cities are added and new events and activities happen. The map allows us to navigate and visit different cities where the project has taken place. For each city, we can visualize the streets named after women and after men marked with different colors. We see the percentage each of them represents, and we are given biographies of the represented women from Wikipedia. In this screenshot, you can see the case for Cochabamba (Bolivia):
Geochicas is not the only community of women in mapping across the globe. Still, it is a particular community I wanted to highlight during this Geography Awareness Week (the week around GIS Day) as I truly admire the dedication and work they have been doing to organize around GIS and to create geodata with a feminist perspective.
Maps are an incredibly useful tool. They allow us to both analyze and communicate our research, and help us easily decide between (and then change) the various qualities, behaviors, attributes, and phenomena we want to relate and link together in space. Maps represent back to us our realities, oftentimes in a neat little square, wrapped up as a jpeg file. I’m going to repeat part of that again: maps represent our realities. Digital tools like the mapping technology GIS (Geographic Information Systems)–as we all must take care to remember–are socially and historically embedded. Maps are never the space itself, but are limited representational technologies of that space.
When we fail to remember that all maps are partial maps, that all maps are situated maps, we are in danger of naturalizing maps as something objective that exists outside of our own knowledge frameworks. When a map is extracted from its cartographic context, the relationship between map and maker is severed, obscuring the origins, intentions, and uses that guided its cartographic process in the first place. Cartographic technologies simultaneously empower and burden us with opportunities to either normalize and legitimate impositions of power, or counter and unmask them. To critically engage with and ethically use GIS in my own scholarship, it is helpful to remind myself of cartographic history and the development of GIS so that I might side-step the pitfalls and problematics that beguiled and deluded the geographers before me.
Whether you’re learning to use GIS and cartographic methods on your own, in coursework, or perhaps through a workshop led by a fellow at the Digital Initiative, you likely won’t learn about the history of mapping beyond, perhaps, the Gall-Peters vs. Mercator projection debate and its moral that all maps are distortions and thus are misleading in one way or another. But cartographic controversy actually dates back to the beginnings of managerial map-making. To rectify the the limited scope in popular cartographic history, I present to you an extremely abridged and partial history of mapping, from manual cartography to ArcGIS, in a few parts. Part one is below. Part two will come in another blog post.
Part One: Some Bad Cartographic History
Modern cartography was developed as a weapon for imperialism—-maps were a tool for effective and efficient violent dispossession. Surveyors were sent alongside imperial soldiers, mapping the landscape that was in the process of being conquered and legitimizing the conquest as it unfolded. With cartography, Pope Alexander VI was able to draw a line between Spanish and Portuguese possessions in the *Inter caetera* in 1493. The geographic partition of India imposed by the British empire in 1947 and legitimated through maps upended the lives of millions of people.
An important precursor to GIS and spatial science is the development of central place theory, developed by German geographer Walter Christaller in 1933. Central place theory was an attempt to use mathematics to understand why towns are located where they are, and where towns should be built in the future. Christaller developed an optimal model for urban development, arguing that towns and cities should be built in hexagonal relation to one another, and the distance between the settlements is determined by what services each settlement has to offer other settlements.
If you’re getting an icky feeling about the imposition of geometric order on community development, you have good intuition. Christaller believed that areas that did not conform to his hexagonal model were irrational, and he worked as a planner for Himmler’s SS during WWII. For the Nazis, Christaller developed a plan for executing an ideal spatial order for redevelopment of eastern Europe, particularly Poland. Christaller’s model was also used to plan the locations of train lines and concentration camps.
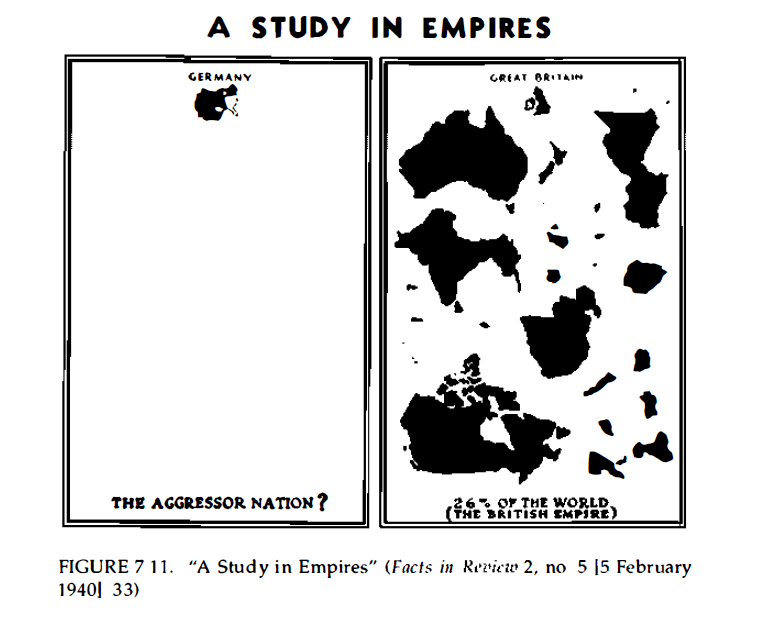
Nazi Germany requires more attention for its use of maps and spatial analysis in pursuit of genocide. During WWII, before the United States entered on the side of the Allies, the German Library of Information published a New York City weekly magazine called Facts in Review. In this magazine, Nazi cartographers published distorted historical maps to decrease American support for Great Britain and France in hopes that the US would stay out of the war.
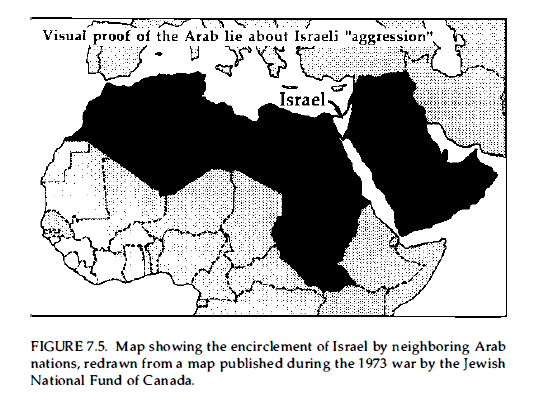
One of the Nazi maps, for example, compares Germany to the British empire and casts Britain as the global aggressor.
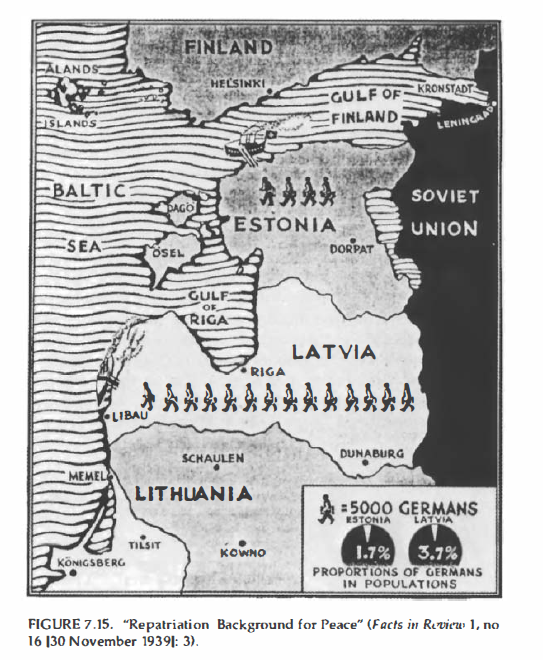
Another Nazi map presents Germany to the US as the peacemaker for the Baltic states. In the accompanying text to the map, Facts in Review states that “Germany is not afraid to correct mistakes of geography and history.”
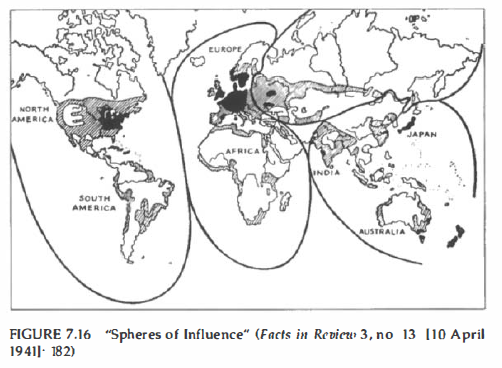
The infamous “Spheres of Influence” maps was also published in Facts in Review, encouraging the US to stay out of Europe.
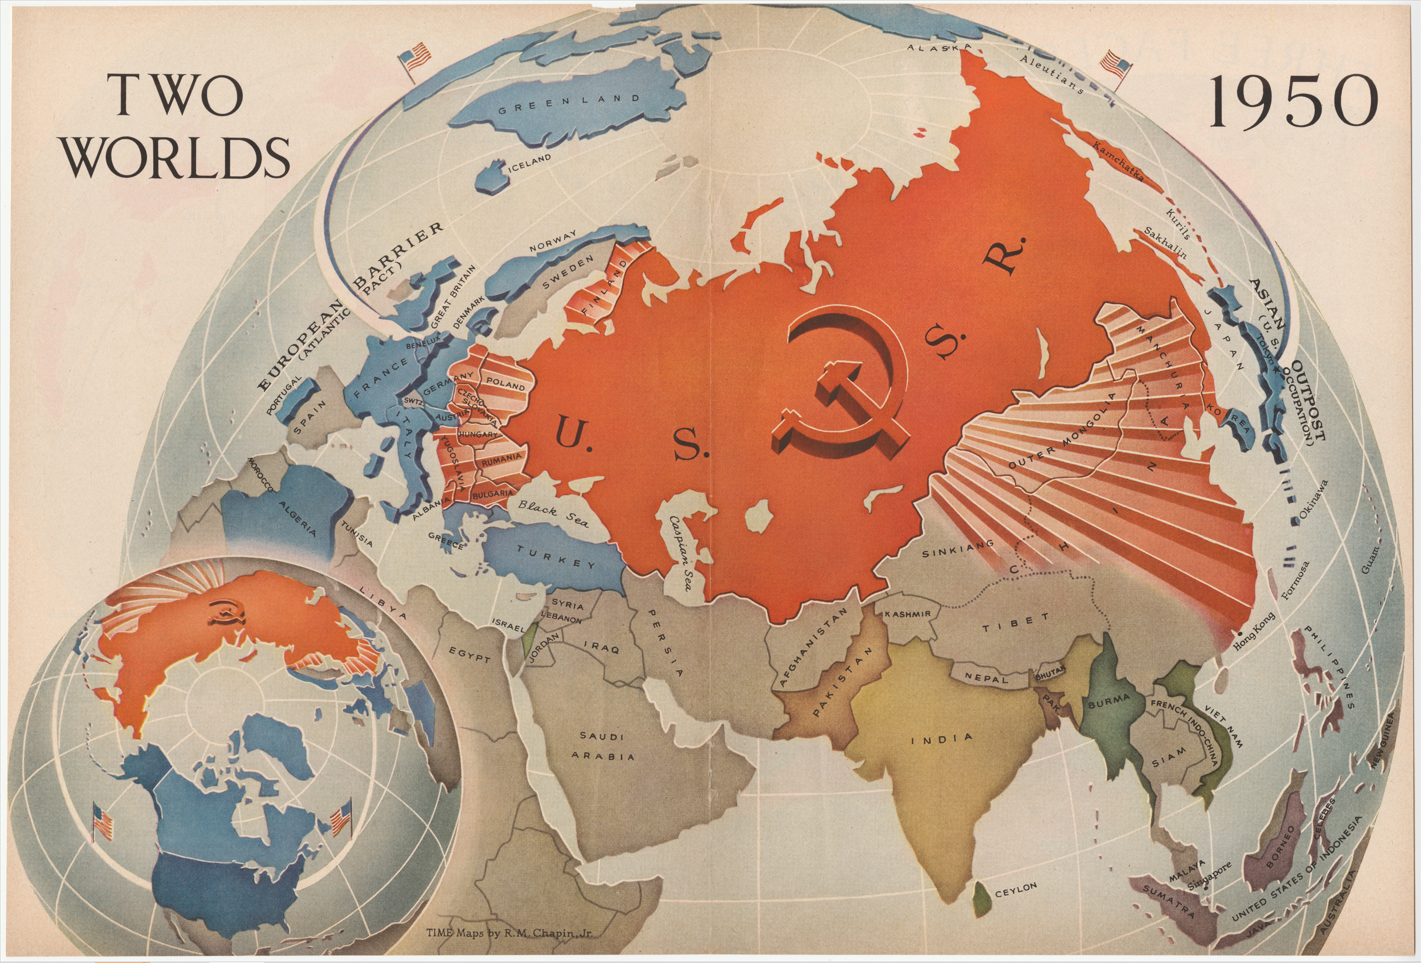
Not dissimilar to the Nazis, the US employed misleading and distorted maps for political means. North-polar projections were favored by the West during the Cold War to over-emphasize the threat of communism “looming” over the rest of the world. This anti-communist map was published in *Time Magazine*.
Even when a projection may be acurate in its portrayal of area, area without context elides a lot. This map of the middle east created during the 1973 Arab–Israeli War sets up a David-and-Goliath narrative, yet says nothing about the mismatch in military technology or Western support between Israel and the coalition of Arab states.
I remind you of this sordid history not to dissuade you from using GIS in your research, but to offer the context of the development of GIS. These maps are often cited as examples of mapping “mistakes,” but history shows us that they are not, in fact, mistakes. They were made with deliberate intention. The cartographic choices we make can have serious consequences, the technology we use comes with a lot of power, and it’s important that we take care in its use. Stay tuned for Part 2 where I’ll cover the development and use of GIS!
Lightning talks are informal, 3-minute / 3-slide presentations that offer a brief insight into your digital humanities project, research, or question. Projects at any stage–whether just beginning, in-development, or completed–are welcome! The audience includes a diverse community of engaged CUNY students and colleagues who are eager to hear about your project and offer feedback.
Present your digital humanities work on Tuesday, November 14th from 5:00pm-7:00pm. This is a hybrid event at the Segal Theatre (1F) and over Zoom. Please register to present or attend here.
Visual Novels (VN) are an increasingly popular form of interactive fiction, now often hitting the tops of the Steam (computer game marketplace) charts in sales. To deliver their story, visual novels typically utilize text with branching storylines and player choice, static images and backgrounds, and sound effects and music.
Recently, I have been interested in how the genre could be tapped for an academic/pedagogical context. For instance, instead of just reading a lesson from a textbook, students might engage with a short educational VN experience that requires them to apply their knowledge to advance the narrative. It would allow for a fun and low-stakes experience that provides immediate feedback and connects with the student through a variety of learning modalities (visual, auditory, textual). Ultimately, what lies at the heart of the visual novel is the ability to not just read or watch a narrative, but to interact with it—and this is where the possibilities get interesting from an educational perspective.
If you have some basic Python knowledge, you already have the skillset needed to make a VN yourself. In this post, I will introduce you to a free and open-source visual novel engine made with Python called Ren’Py, and demonstrate how a basic VN is built with it.
Getting Started with Ren’Py
Although it is possible to build a visual novel from scratch with Python, there are several frameworks and engines out there that can do much of the heavy lifting for you. For Python scripting, Ren’Py is one of the best and most popular, with fully fleshed-out features for implementing branching dialogue, images, and sound effects. It also has detailed documentation and a helpful community.
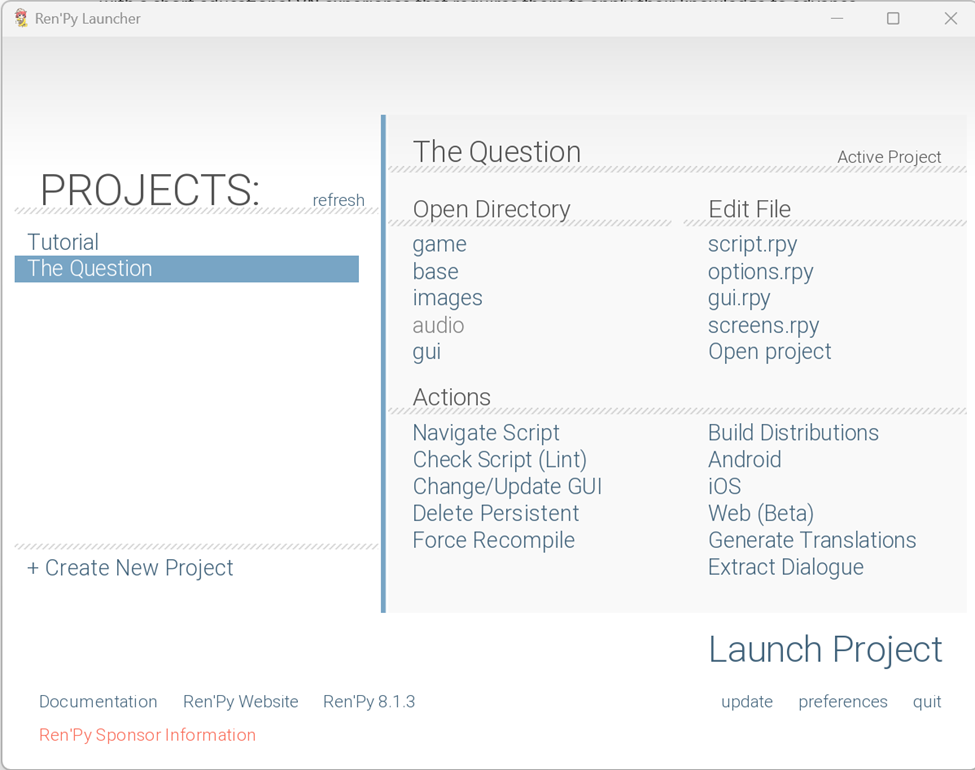
To get started, you first need to download the Ren’Py launcher. Simply download the SDK and extract the folder. Within the folder, you will find a renpy.exe file—double-click this file to run the launcher.
Note: During the installation, the program might ask which code editor you’d like to use. While any of the options they present will do, my personal choice is VSCode. If you use VSCode, I highly recommend installing the Ren’Py Language extension for ease of use, as well. Once you launch Ren’Py, the application will look something like this:
Creating a New Project
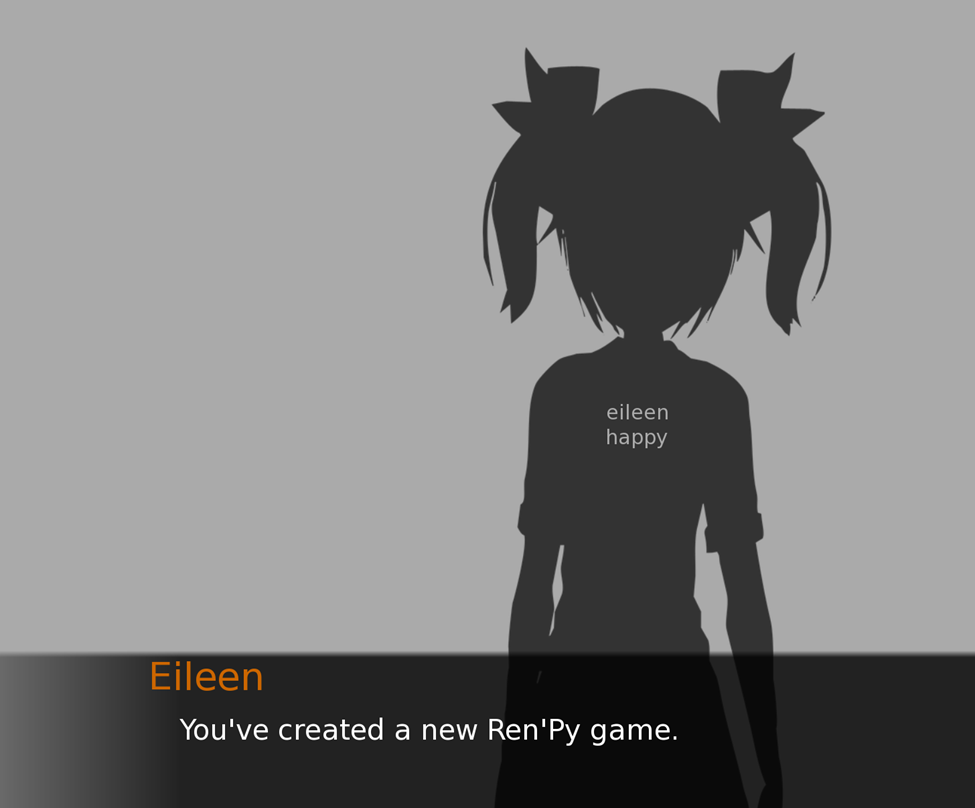
Click the Create New Project button and follow the prompts to determine the directory, the name of the project, the screen resolution, and the starting theme colors (each of these options can be changed later). Ren’Py will then process and create a new project that you can see in the Projects directory.
Let’s go ahead and launch the project. You will see that Ren’Py has populated the game with some content already: a menu screen, and, once you click to Start the game, a basic interaction with a placeholder character named “Eileen.”
Let’s look at how we can make some edits to the project, including adding our own character and dialogue choices.
Editing Your Project
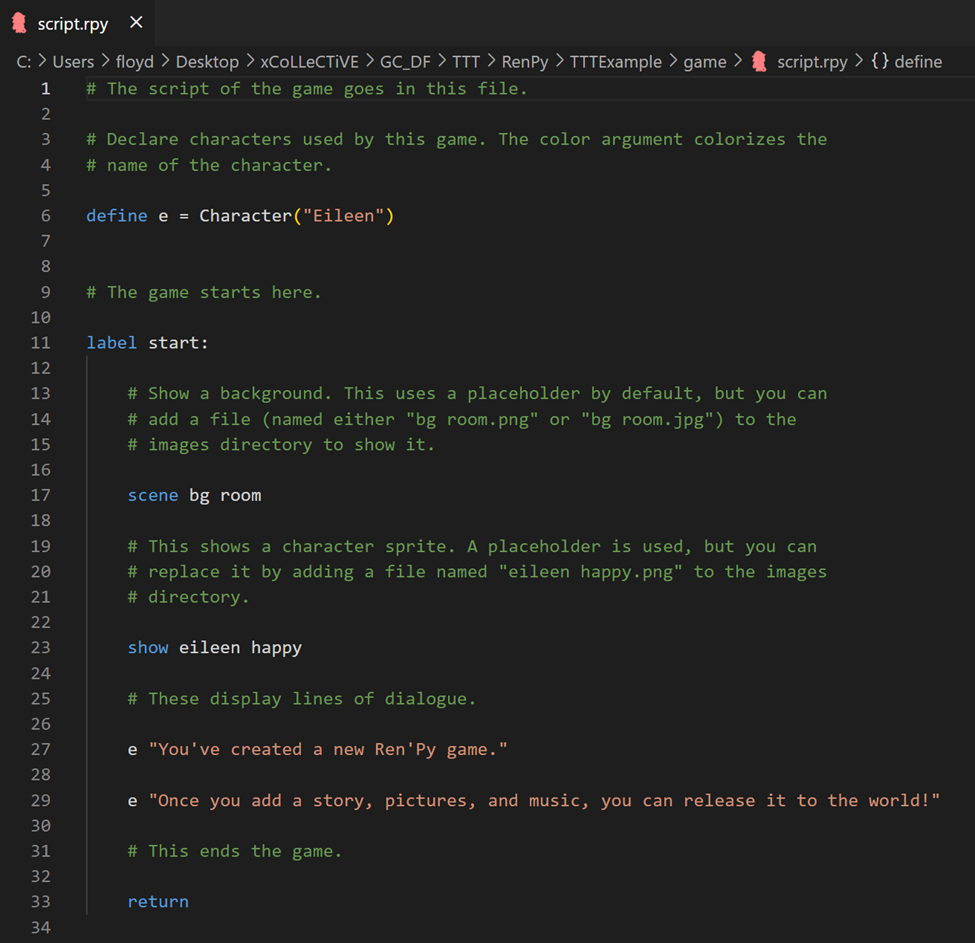
Under the hood, Ren’Py has predefined functionality for controlling and modifying text, images, and sounds. If you look to the Edit File section of the launcher, you will see a script.rpy file. For directly editing the content of the game, this is the file we want. Go ahead and open it now, and you should see the following:
If you are familiar with Python, the general syntax should be recognizable to you. However, many of the statements (label, scene, show, etc.) are unique to Ren’Py. Helpfully, you can see that the developers have written some comments (preceded by a hash) to explain some of these statements.
Let’s make some edits to create an educational game for an imagined Intro to Philosophy class. We can begin by defining a new character—let’s say good ole Socrates. In place of the character definition for Eileen, we can write the following:
define s = Character(“Socrates”, color="#c8ffc8")
Here, we have created a new variable (s, short for Socrates) that is of the predefined Ren’Py class Character. The full name of the character is defined in quotation marks and is what will be displayed on the screen. We have also set a color (a sort of light green) for the character’s name.
Now that we have a character, let’s continue. In the script, the next statement we see is “label start:”. In short, this is where the game loop will begin. Everything that we want to occur during the game should be placed within the start label, using typical Python indentation.
Following this, we can see a “scene” statement. This displays a background image for the current game screen and can be loaded from your image files in the /images directory. For now, let’s not worry about this, and instead focus on displaying our character and presenting some interactive dialogue.
Adding Interactivity
Let’s engage with our Socrates character. To add our own images, we can place them in the game/images folder. I have added a new image file, “socrates.png”, to my /images folder. To display it on the screen, we can use the “show” label, like so:
show socrates at truecenter
Ren’Py searches for image files in the /images directory, which can be found by selecting “images” in the “Open Directory” section of the launcher. Ren’Py expects character art to be an PNG, WEBP, or AVIF file, while background art should be a JPG, JPEG, PNG, WEBP, or AVIF file. The name of a file is very important – the extension is removed, the file name is forced to lowercase, and that’s used as the image name. I have also added an “at truecenter” attribute to my code, to position my image in the center of the screen both vertically and horizontally.
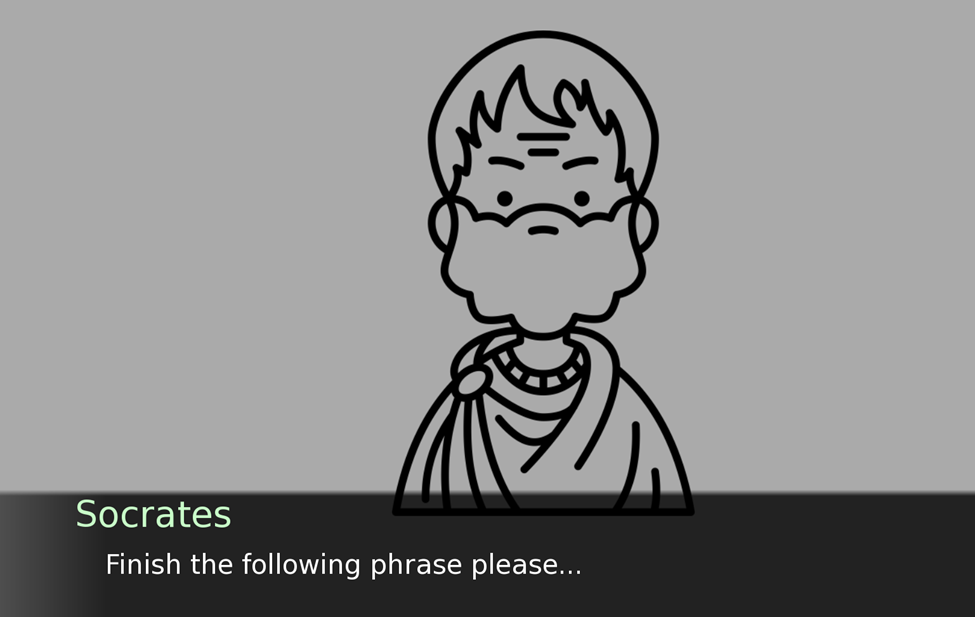
Next, we’ll give Socrates some dialogue. Let’s have the player finish Socrates’ famous quote “I know that I know nothing.”
s "Finish the following phrase please..."
s "I know that I know..."
The result looks like this:
Next, let’s add a menu of options for the player’s response. To do this, we can use the “menu” statement, like so:
menu:
        "Nothing":
            s "Correct!"
            jump end
        "Everything":
            s "Wrong!"
            jump end
label end:
    s "That's all for now."
return
“Menu” allows us to create some options for the player to choose from (in this case, “Nothing” or “Everything). If the player chooses “Nothing”, Socrates will say “Correct!”, and if the player chooses “Everything”, Socrates will say “Wrong!”.
Whichever choice the player makes, the program will then “jump” (using the jump statement) to the “label end”, which is the end of our program. The jump statement is crucial, as it transfers control to a label defined using the label statement, and the script statements following the label are run. In this case, we simply have Socrates say “That’s all for now.” We then end the game with a “return” statement.
The full code looks like this:
define s = Character("Socrates", color="#c8ffc8")

label start:

    scene bg room

    show socrates at truecenter

    s "Finish the following phrase please..."

    s "I know that I know..."

    menu:

        "Nothing":
            s "Correct!"

            jump end

        "Everything":
            s "Wrong!"

            jump end

label end:
    s "That's all for now."

    return
And that’s it! We have now created a simple game that allows the player to interact with a character and make choices to determine the flow of the game.
Learning Resources
As I mentioned before, Ren’Py has excellent documentation. I’d highly recommend looking through the documentation if you’d like to learn about Ren’Py in more detail.
Our first meeting of the semester will be Thursday 19th October at 5pm– find out more: http://cuny.is/rug
Need help with the Commons?
Email us at [email protected] so we can respond to your questions and requests. Please email from your CUNY email address if possible. Or visit our help site for more information: